
Authors:
Ron Larson, Bruce H.edwards
Chapter:
Preparation For Calculus
Exercise:
P. Review Exercises
Question:46 | ISBN:9780547167022 | Edition: 9
 Question
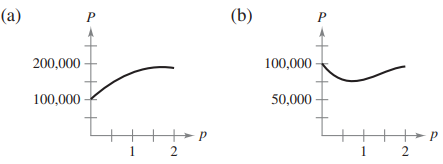
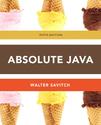
Writing The following graphs give the profits for two small companies over a period
of 2 years. Create a story to describe the behavior of each profit function for some hypothetical product the company produces.


Sorry the answer is not available at the moment…
If you are able to find the answer, please make sure to post it here. So that your Juniors have smile on their lips and feel happy.
Spread the 'tradition of sharing'.