
 Question
Stress Test A machine part was tested by bending it centimeters 10 times per minute until the time
(in hours) of failure. The results are recorded in the table.
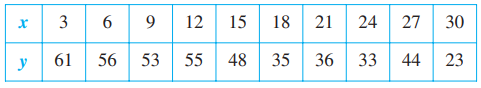
a) Use the regression capabilities of a graphing utility to find a linear model for the data.
(b) Use a graphing utility to plot the data and graph the model.
(c) Use the graph to determine whether there may have been an error made in conducting one of the tests or in recording the results. If so, eliminate the erroneous point and find the model for the remaining data.


Sorry the answer is not available at the moment…
If you are able to find the answer, please make sure to post it here. So that your Juniors have smile on their lips and feel happy.
Spread the 'tradition of sharing'.